Overview
The health of the storage system in one screen, refreshed every 10 s from unsigned core.status calls to every core
peer (unsigned: the call carries no tenant data, so it needs no role).
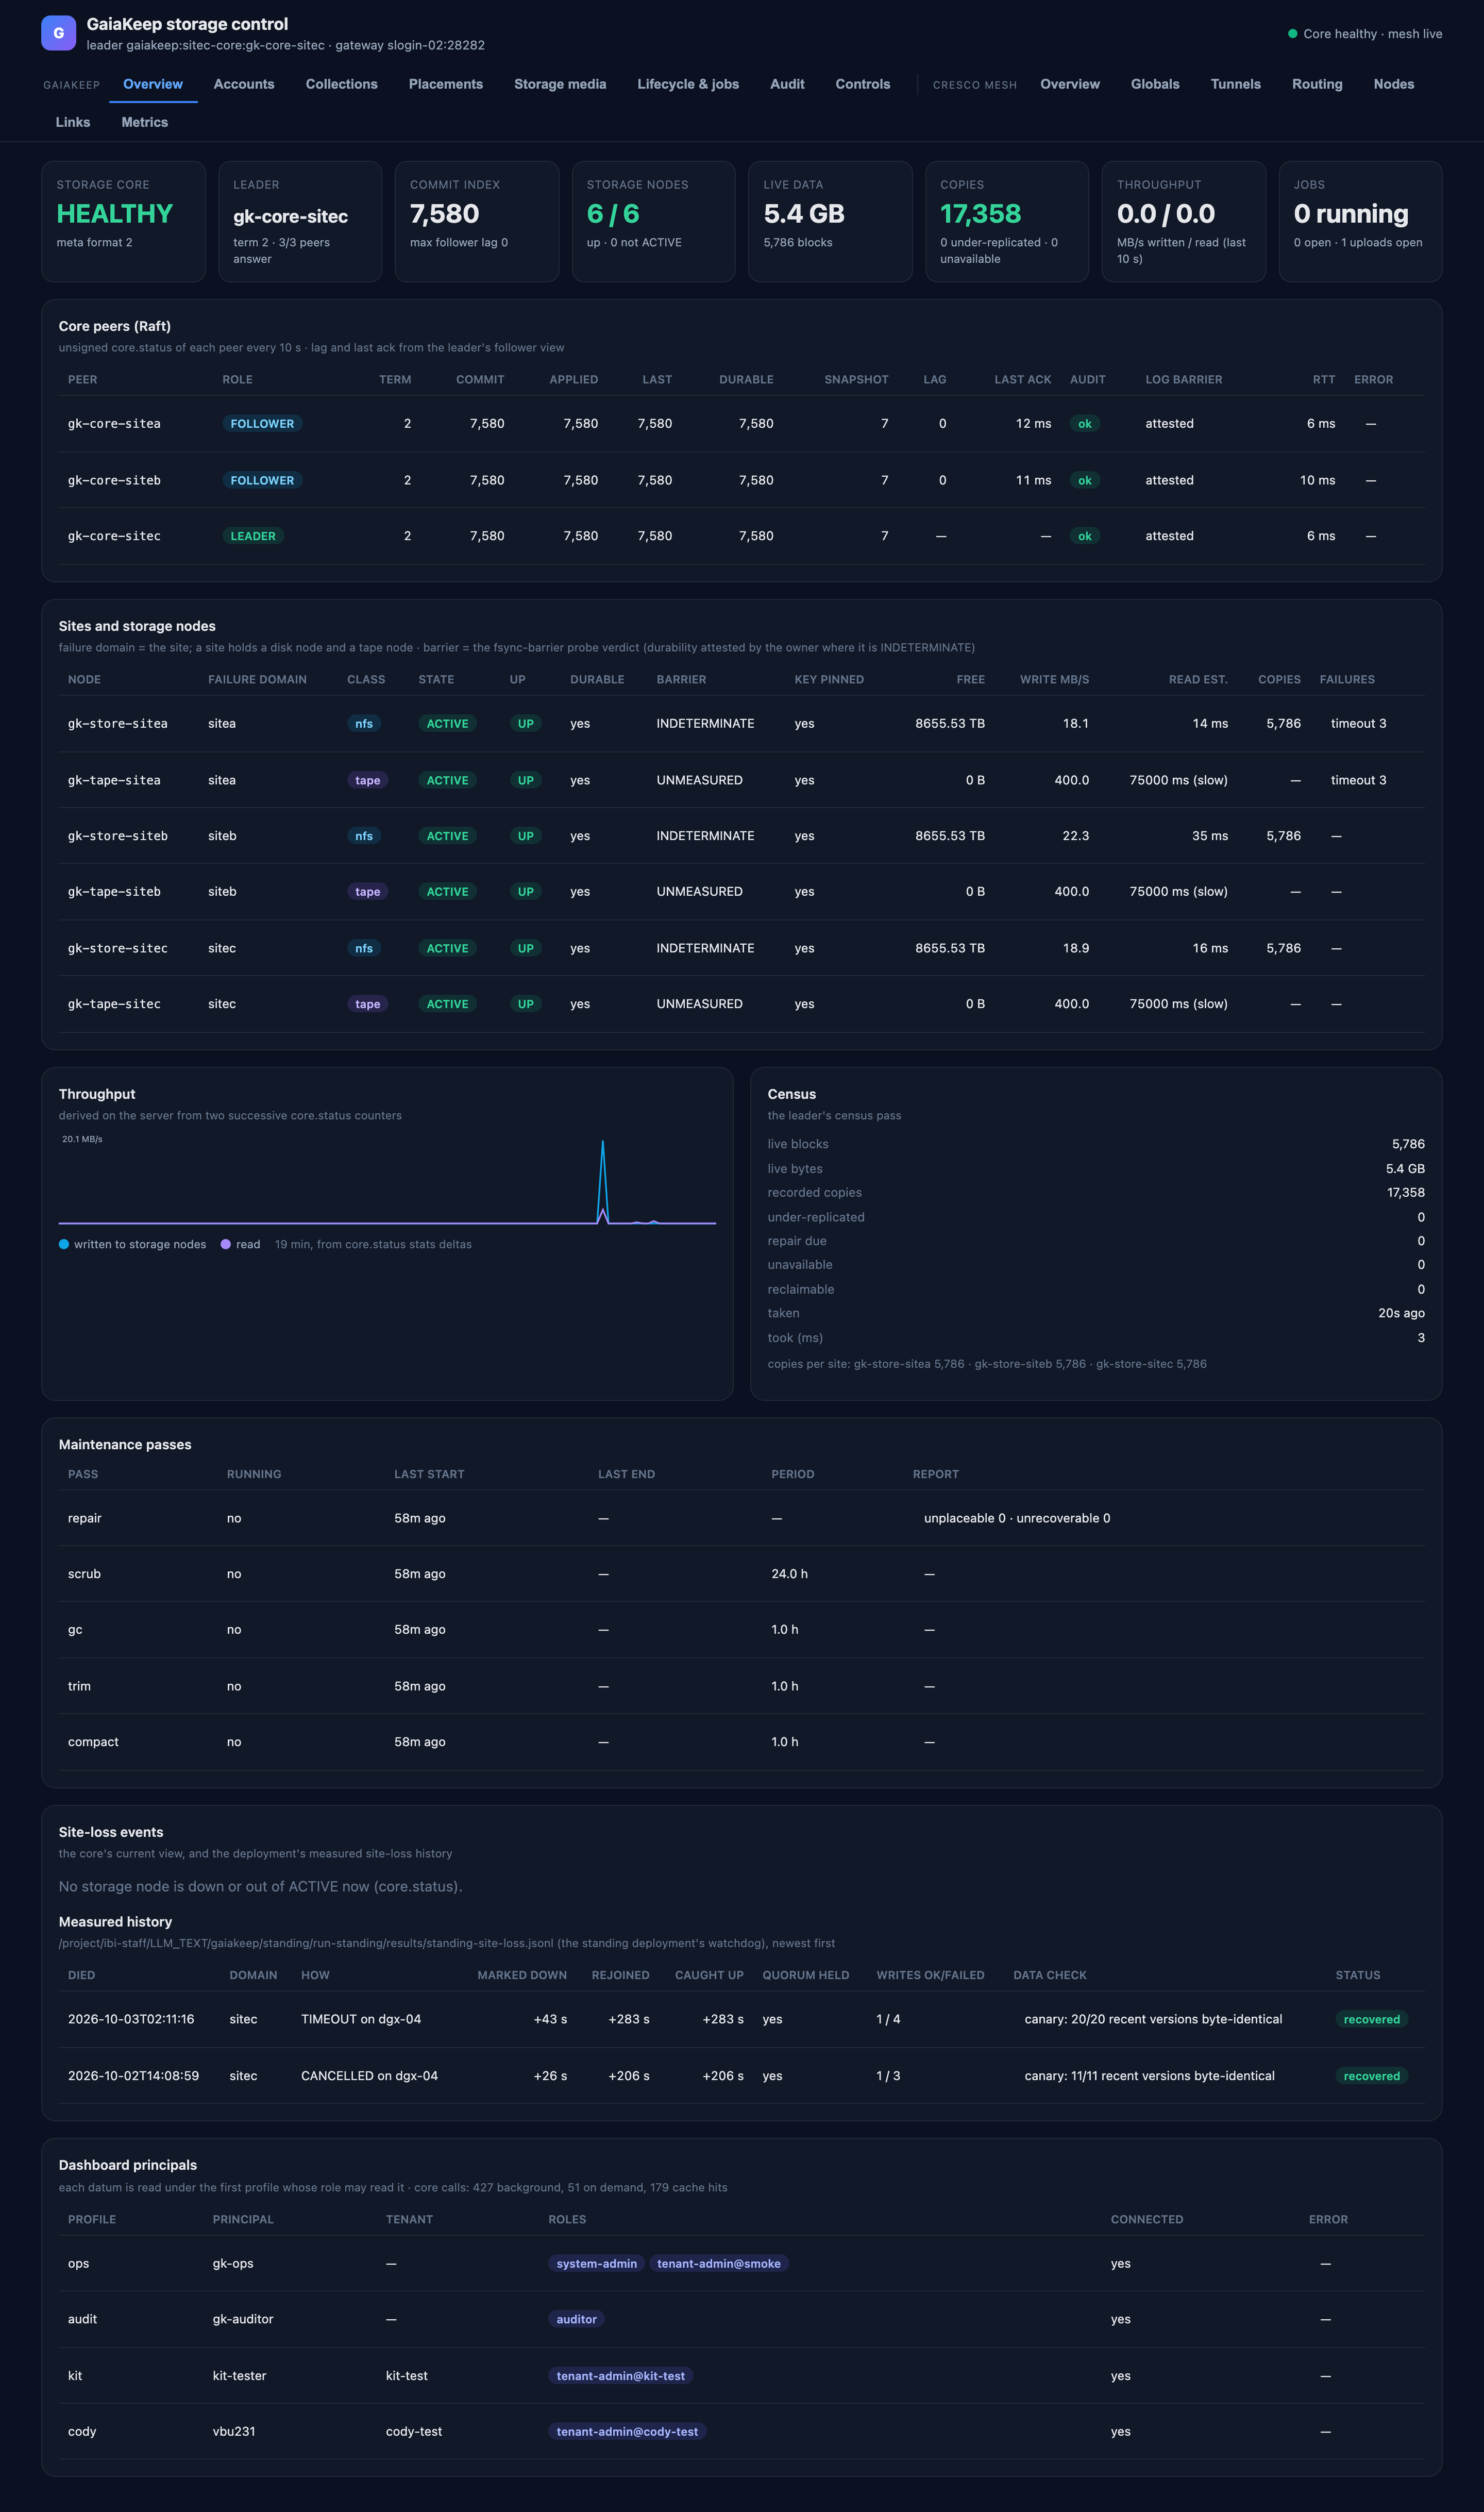
The tiles
| Tile | Meaning |
|---|---|
| Storage core | The overall verdict — HEALTHY when every peer serves and every site is up and ACTIVE. The sub-line names the journal format the core writes (meta format 2). |
| Leader | Which peer leads the replicated core log, and its Raft term (term 2 · 3/3 peers answer). |
| Commit index | The newest journal index committed by the quorum, and the worst follower lag in entries. |
| Storage nodes | How many storage nodes are up and how many are not ACTIVE (6 / 6 above). |
| Live data | Logical bytes of live data and the number of live blocks in the census. |
| Copies | Recorded copies of those blocks, plus how many are under-replicated or unavailable (0 / 0 is the healthy state). |
| Throughput | MB/s written to storage nodes and read back, averaged over the last 10 s. |
| Jobs | Jobs running now, open jobs, and uploads open. |
Core peers (Raft)
One row per core peer, from unsigned core.status of each peer; lag and last-ack come from the leader's follower
view.
| Column | Meaning |
|---|---|
| Peer / Role / Term | The peer's address, its Raft role (LEADER, FOLLOWER) and the term it was elected in. |
| Commit / Applied / Last / Durable / Snapshot | Journal indexes: committed by the quorum, applied to this peer's state, the peer's last, the newest durably on disk, and the newest compacted into a snapshot. |
| Lag / Last ack | Entries behind the leader, and how long ago the leader heard from the peer. |
| Audit | The peer's audit-log chain state (ok, or lost — a loss is journaled and must be acknowledged). |
| Log barrier | The fsync-barrier verdict for this peer's journal (attested where the owner has attested the storage). |
| RTT / Error | Round-trip time of the status call, and the peer's last error, if any. |
Sites and storage nodes
One row per storage node — a site is a failure domain holding a disk node and a tape node.
| Column | Meaning |
|---|---|
| Node / Failure domain / Class | The node's address; the site it lives in; nfs (disk), tape or pack. |
| State / Up | The node's registration state (ACTIVE…) and whether it answers. |
| Durable | Whether what the node acked as stable is known to survive a restart. |
| Barrier | The fsync-barrier probe verdict (INDETERMINATE where the hardware cannot be probed — durability is then attested by the owner, noted in the page's sub-line). |
| Key pinned | Whether the node's key is pinned (a pinned key is refused if the node re-registers with a different one). |
| Free / Write MB/s / Read est. | What the node reports free, its measured write rate, and the estimated time to a first byte on a read (tape reads ~75 s). |
| Copies | Live copies held on the node. |
| Failures | Recent failures by class (for example timeout 3). |
Throughput
Written-to-storage and read-back rates in MB/s, derived on the server from two successive core.status counter
reads — the chart is a 30-minute history, one sample per poll. The core's own counters are the only source; the
dashboard never measures traffic itself.
Census
The leader's census pass over live blocks:
| Row | Meaning |
|---|---|
| Live blocks / Live bytes | Blocks and logical bytes that some version references. |
| Recorded copies | Copies of those blocks across all sites. |
| Under-replicated / Repair due / Unavailable | Copies below the required count, repairs scheduled, blocks with no readable copy. |
| Reclaimable / Taken | Blocks no live version references any more and the gc pass's progress on them. |
| Copies per site | The same census grouped by site. |
Maintenance passes
The five background passes — repair, scrub, gc, trim, compact — with whether each is running now, when it last ran,
its period, and its last report (for example unplaceable 0 · unrecoverable 0 for repair).
Site-loss events
The core's current view (any storage node not up or not ACTIVE, with when it went down), and beneath it the
deployment's measured history from the standing watchdog's site-loss log: when a site died, how (timeout,
cancelled job), when it was marked down, when it rejoined and caught up, whether the quorum held and writes
succeeded throughout, and the canary's byte-identical data check on the versions written across the event. Every
recorded incident ends recovered.
Dashboard principals
The profiles the server runs with, their principals and bindings, whether each is connected, and its last error — plus the server's own call counters (background, on demand, cache hits). This is the transparency counterpart of "no new visibility": every page names the profile that read its data.
Source verbs: unsigned core.status per peer every 10 s; the site-loss log file every 60 s. At very large node
counts the per-site table is meant to give way to the census alone — see the design record's open items.